Sim Science proudly stands as a brand that recognizes sim racing has become an unnecessarily expensive hobby. Our passion for the sport comes through in the wide selection of tools we give our community, for free. So let's get to it.
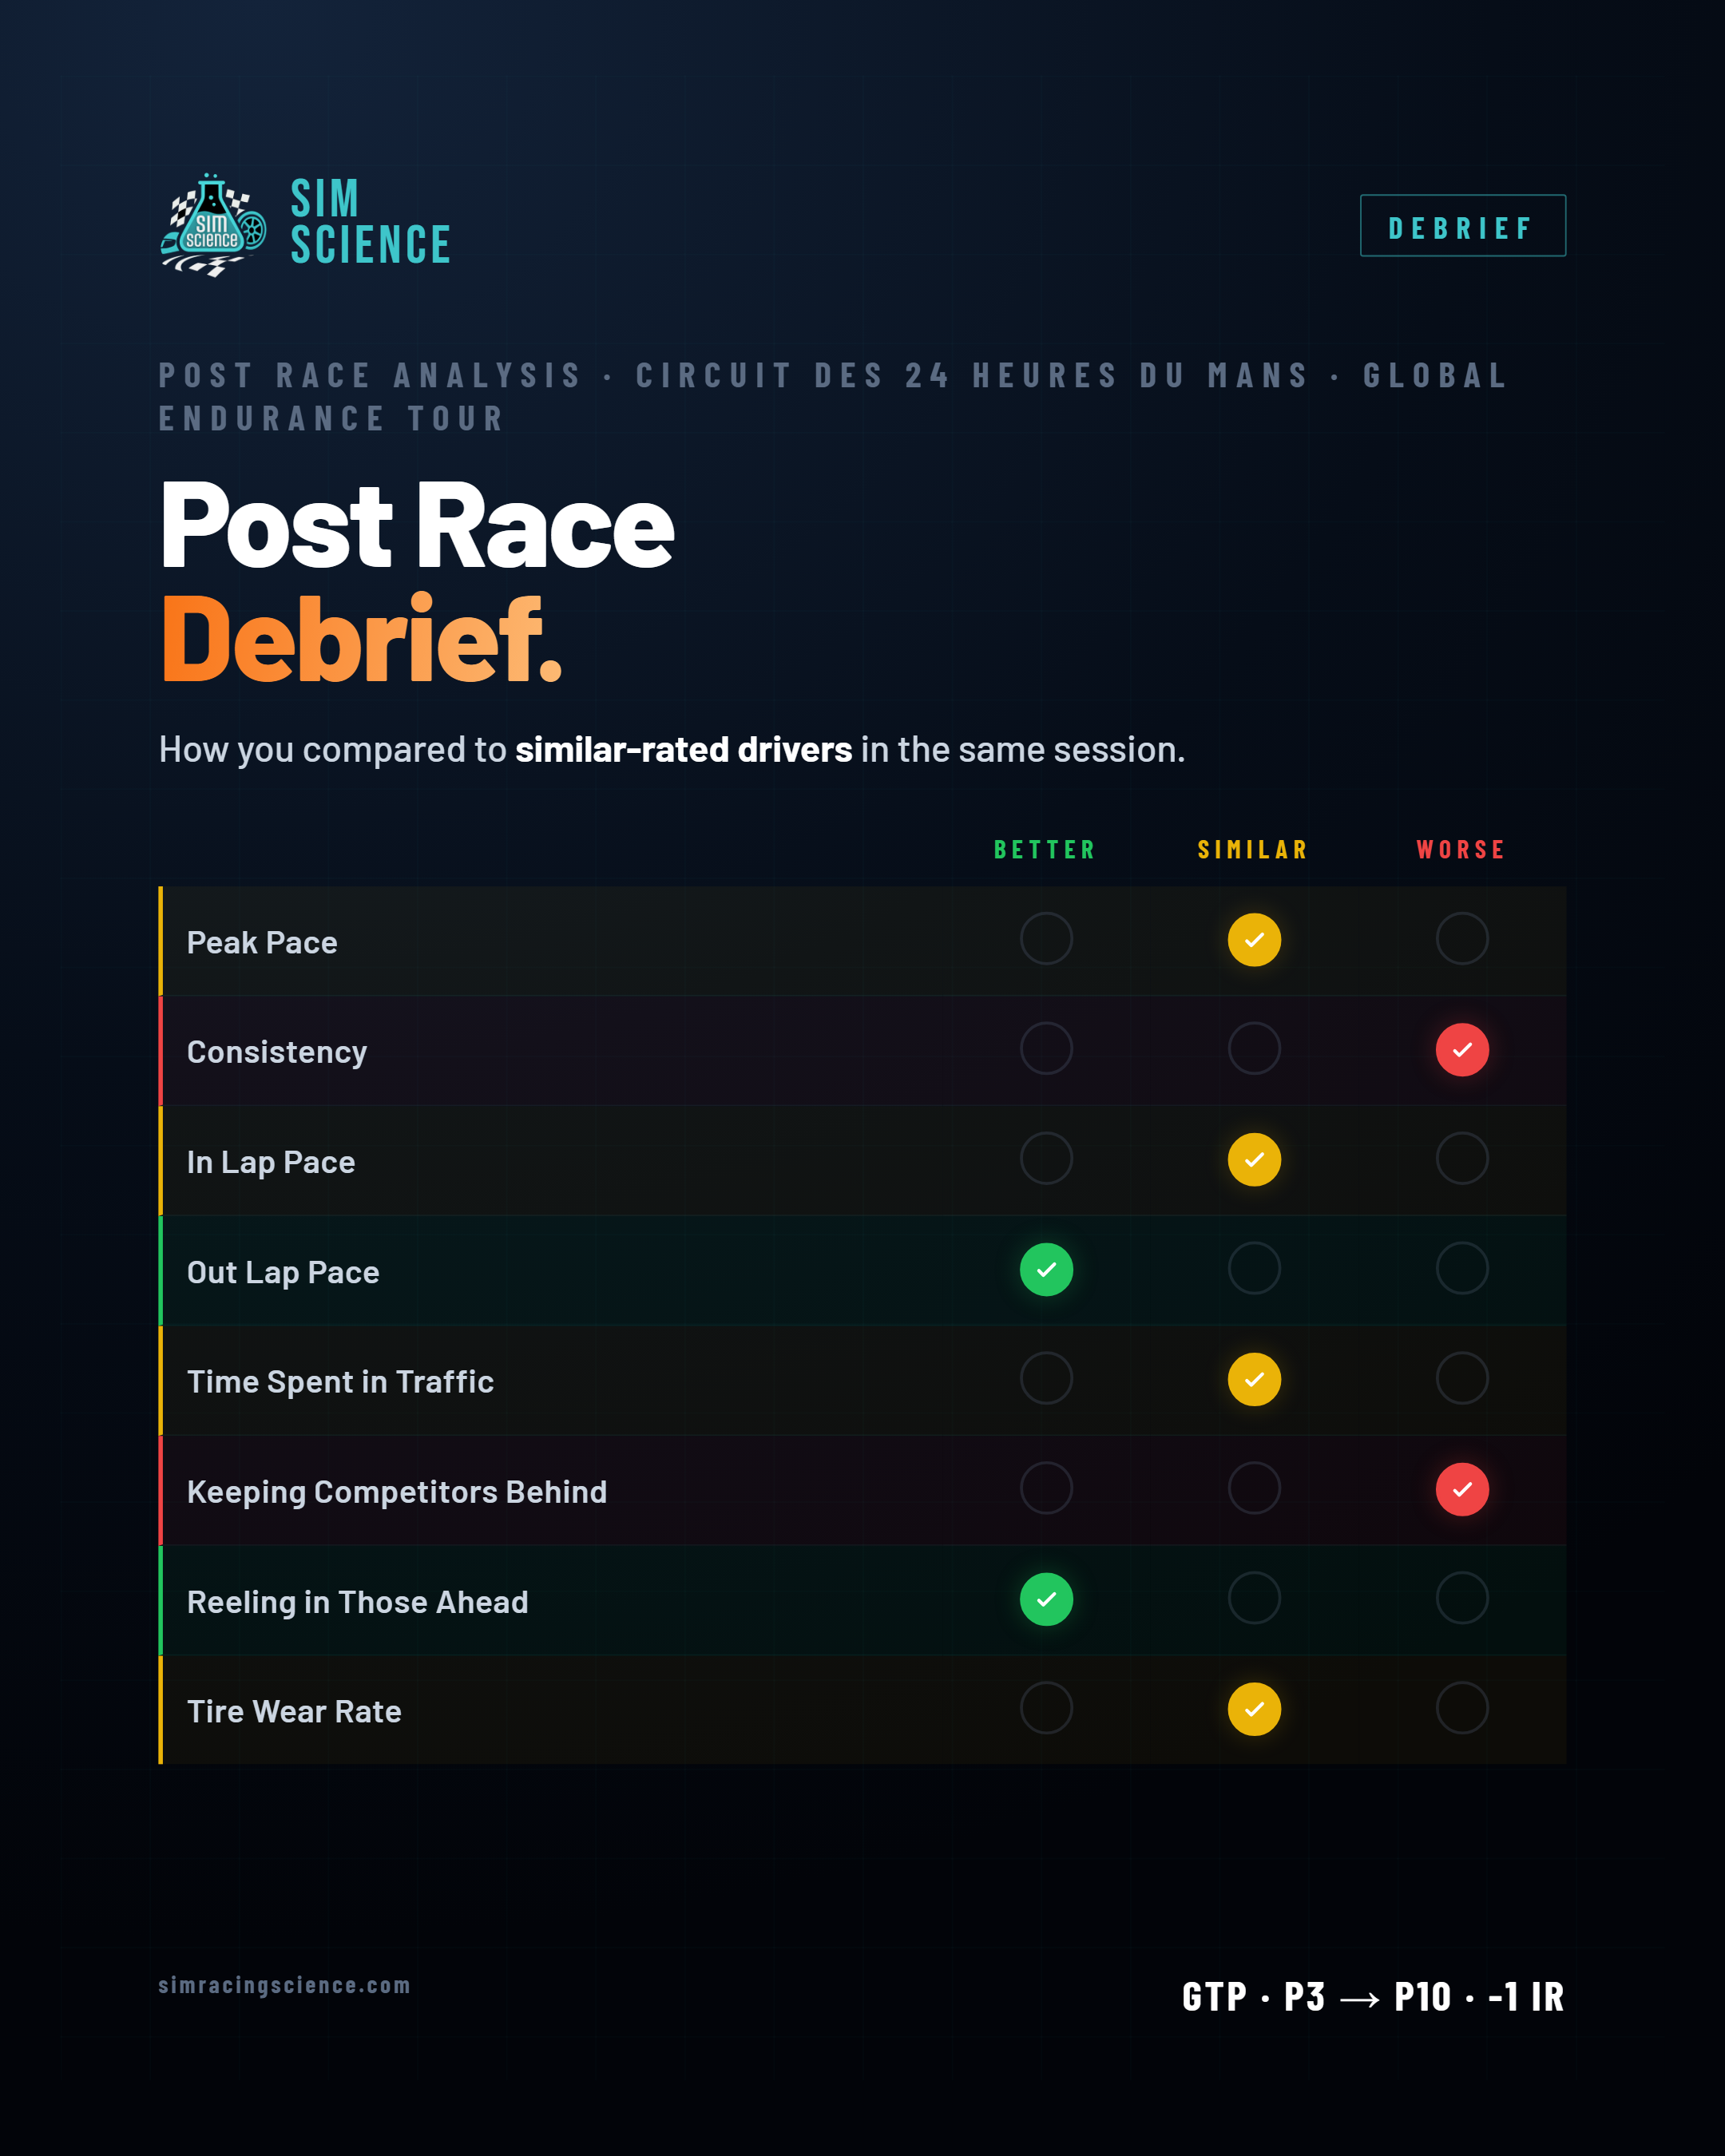 Click to expand for full detail
Understand your race across seven key elements, each comparing you to drivers in the same session, adjusted for skill range and grid position so the comparison is actually fair. No vague "you were slow." Seven specific answers to seven specific questions about where your time really went.
"Keeping Competitors Behind" is our founder's favorite. It looks at the laps we mark as defending — where the car behind is close at the line — and asks one thing: are you still hot-lapping while you defend, or is your pace falling off a cliff while you play cork-in-the-bottle? We measure your defending pace against others in the same spot, and tell you how you held up.
 Click to expand for full detail
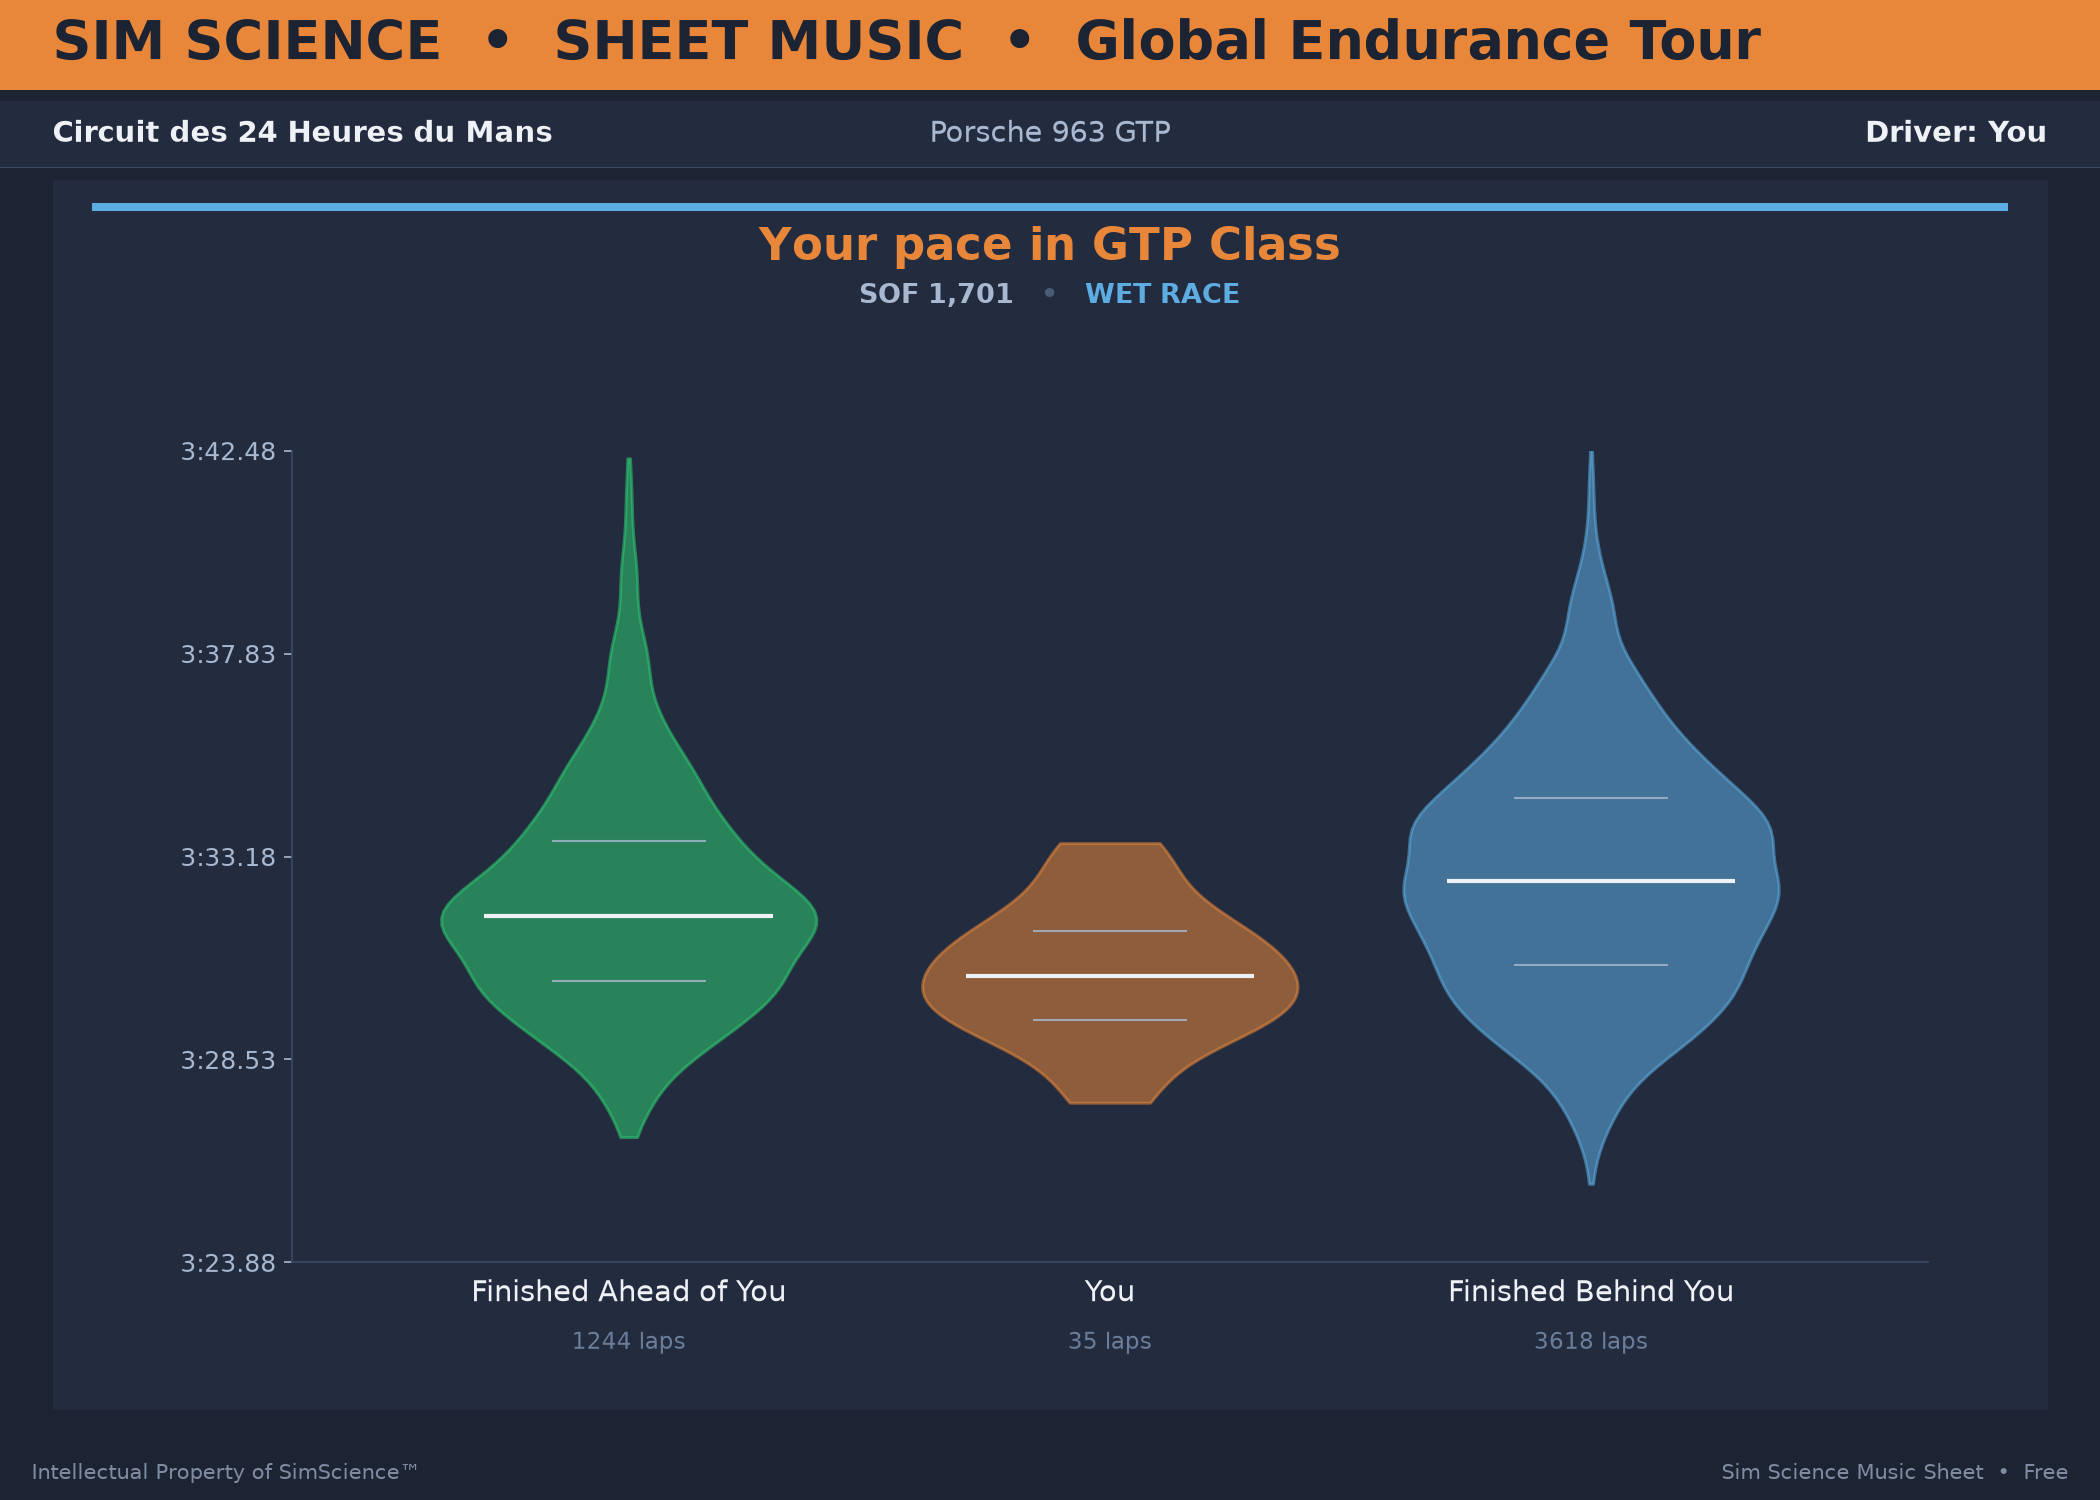
A violin plot works like a sound wave — the fatter the shape, the more laps you ran at that pace. Pay attention to the tips of the plot, not just the white percentile bars. The median pace of drivers who finished ahead of our driver was only a little quicker; those who finished behind were much slower.
Notice the bigger gap in the green plot compared to the orange — a "longer tail," meaning more inconsistency in that pool of laps.
The takeaway: this race was likely lost on strategy — or at least, it wasn't our driver's pace at fault. His 35 laps are quick and consistent, relative to the field both ahead and behind.
