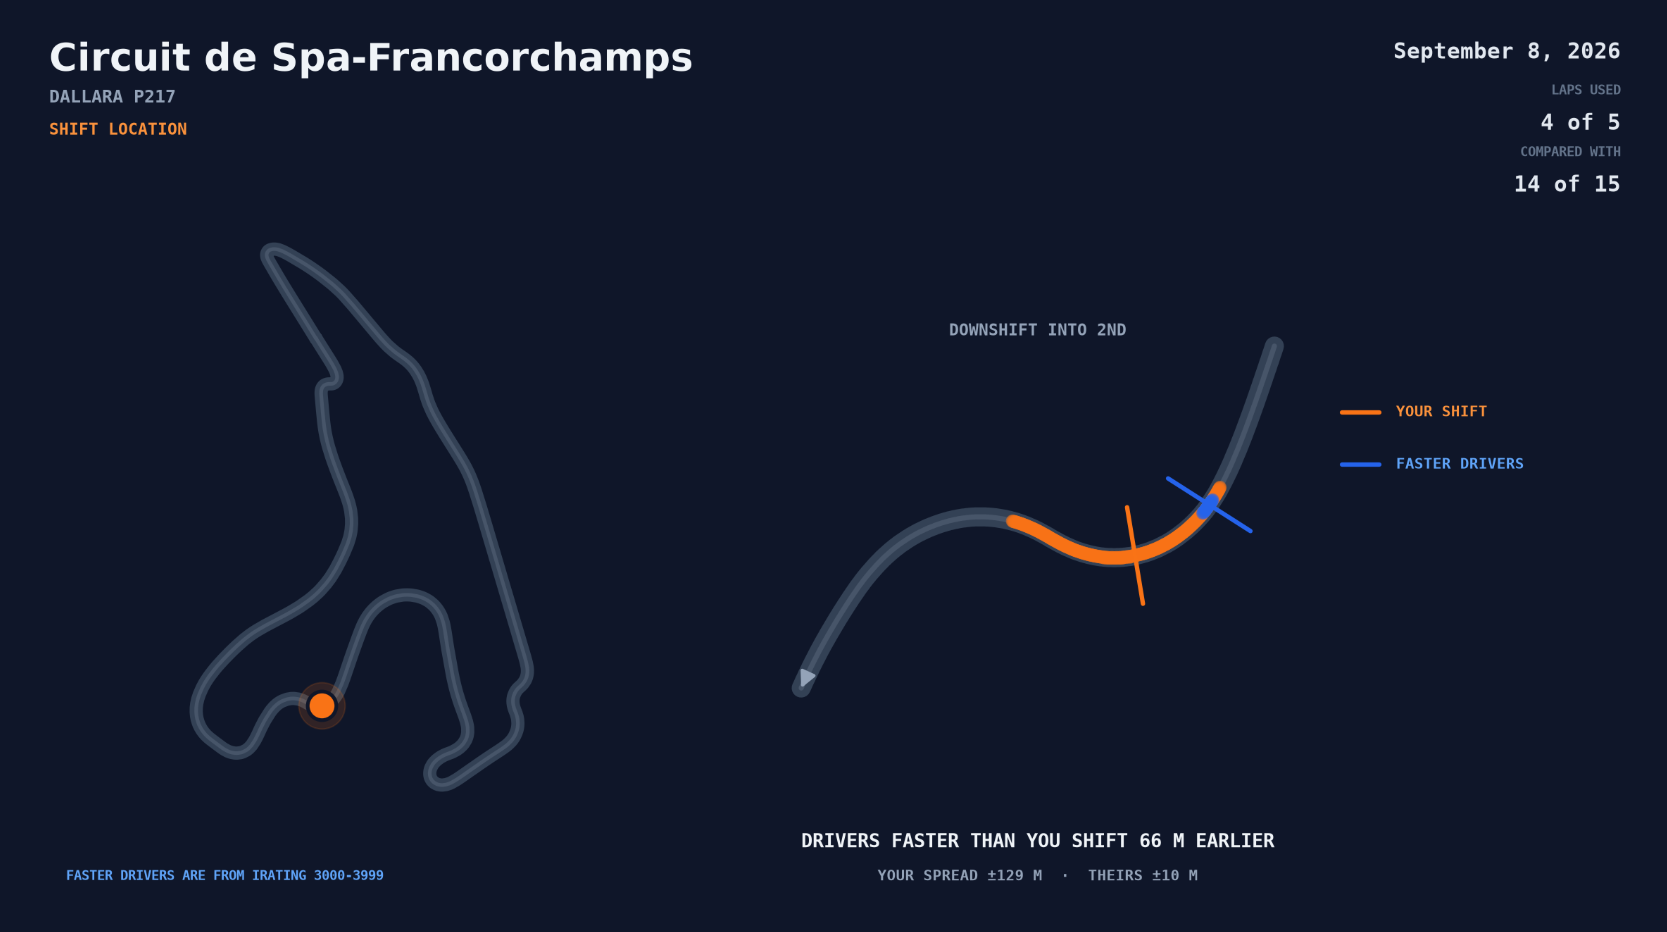
These are real Sim Science telemetry visuals from a consenting driver — the actual output, not a mockup. Each one turns a lap full of numbers into a single picture of where your time goes, and what to do about it. Click any to expand.
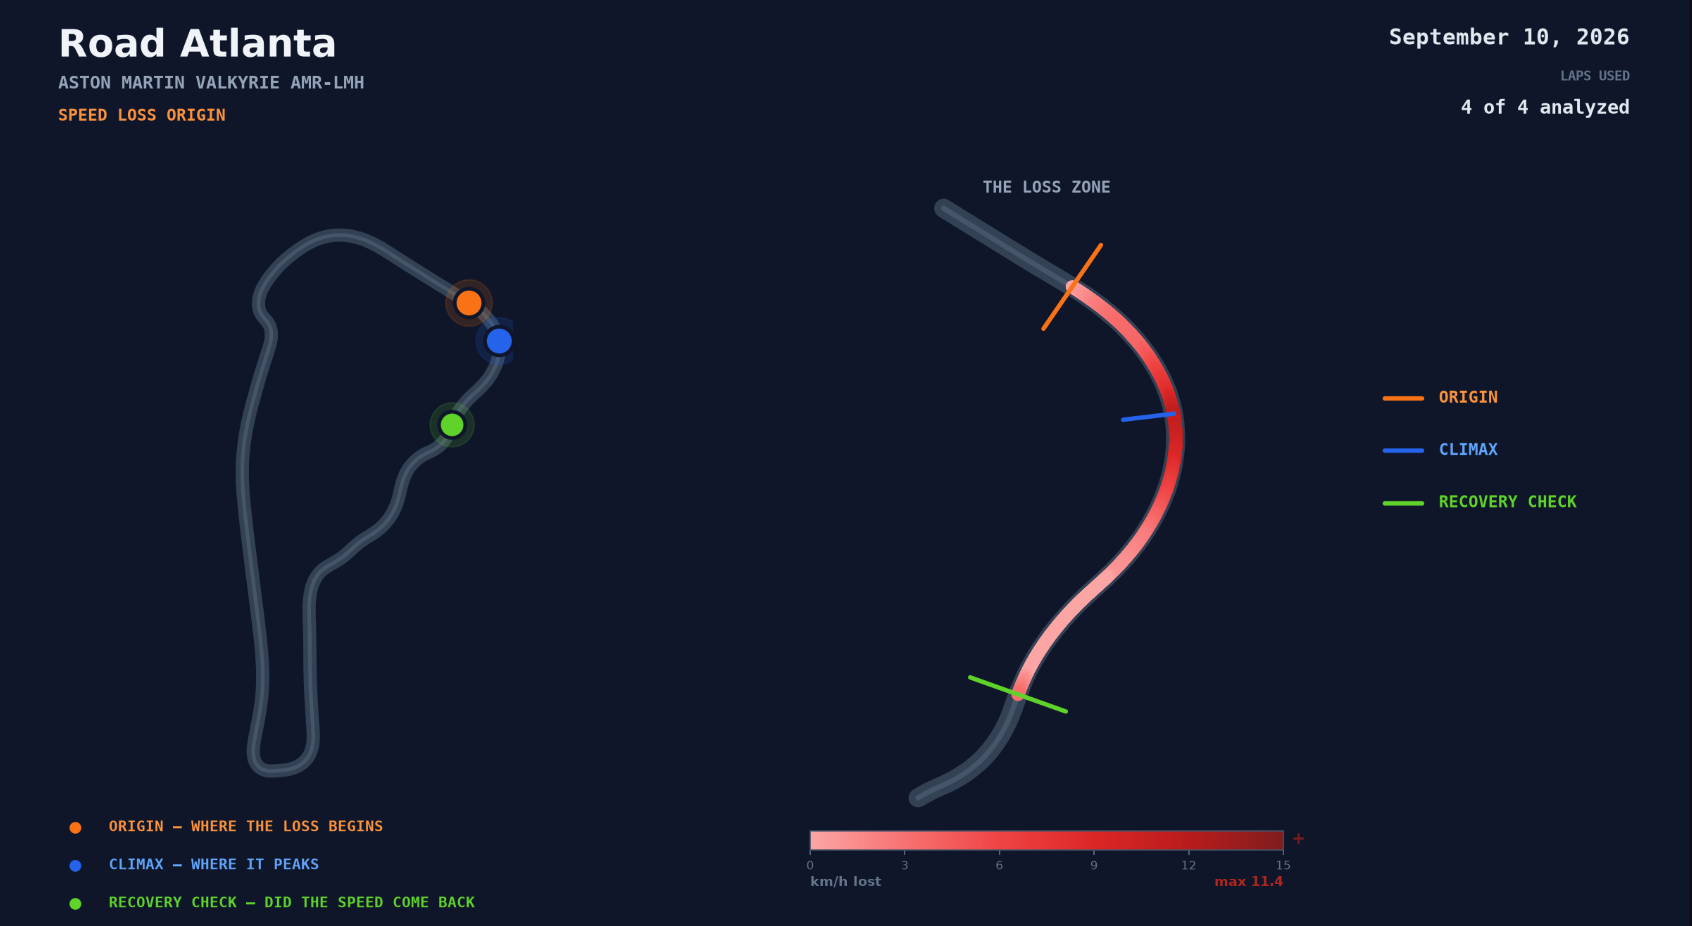
Where your speed starts bleeding, where the loss peaks, and whether it ever comes back. Origin, climax, recovery — pinpointed to the exact stretch of track, so you fix the cause, not the symptom.
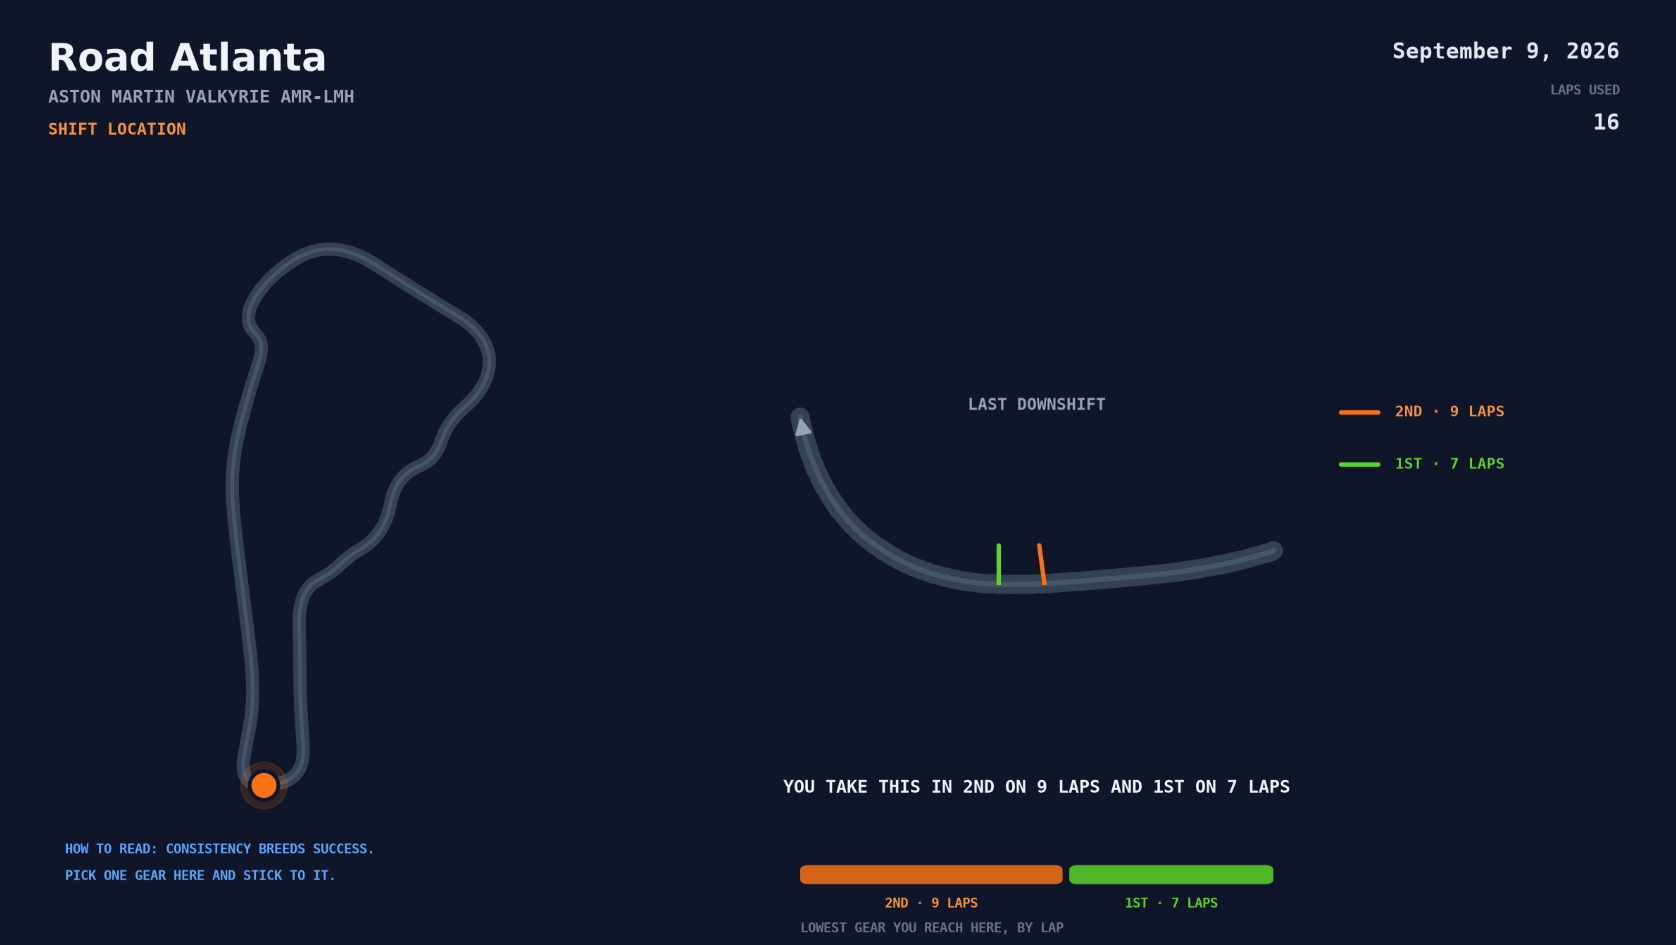
Where you downshift, corner by corner. Consistency breeds success — this shows whether you're picking one gear and sticking to it, or scattering your entry and paying for it in lap time.
Your shift point measured against drivers a tier above you. In this example they downshift 66 metres earlier and far more consistently — a concrete, copyable habit, not a vague "go faster." This is what a telemetry insight that matters looks like.